Mastering Spend Analytics: 4 Steps to Drive Real Value

Why Traditional Spend Analytics Falls Short
When we talk about the 4 essential steps in Spend Analytics they look very simple and straightforward:
Collect & consolidate the data
Clean & normalize the data
Enrich the data (classify & group)
Visualize the data and generate insights
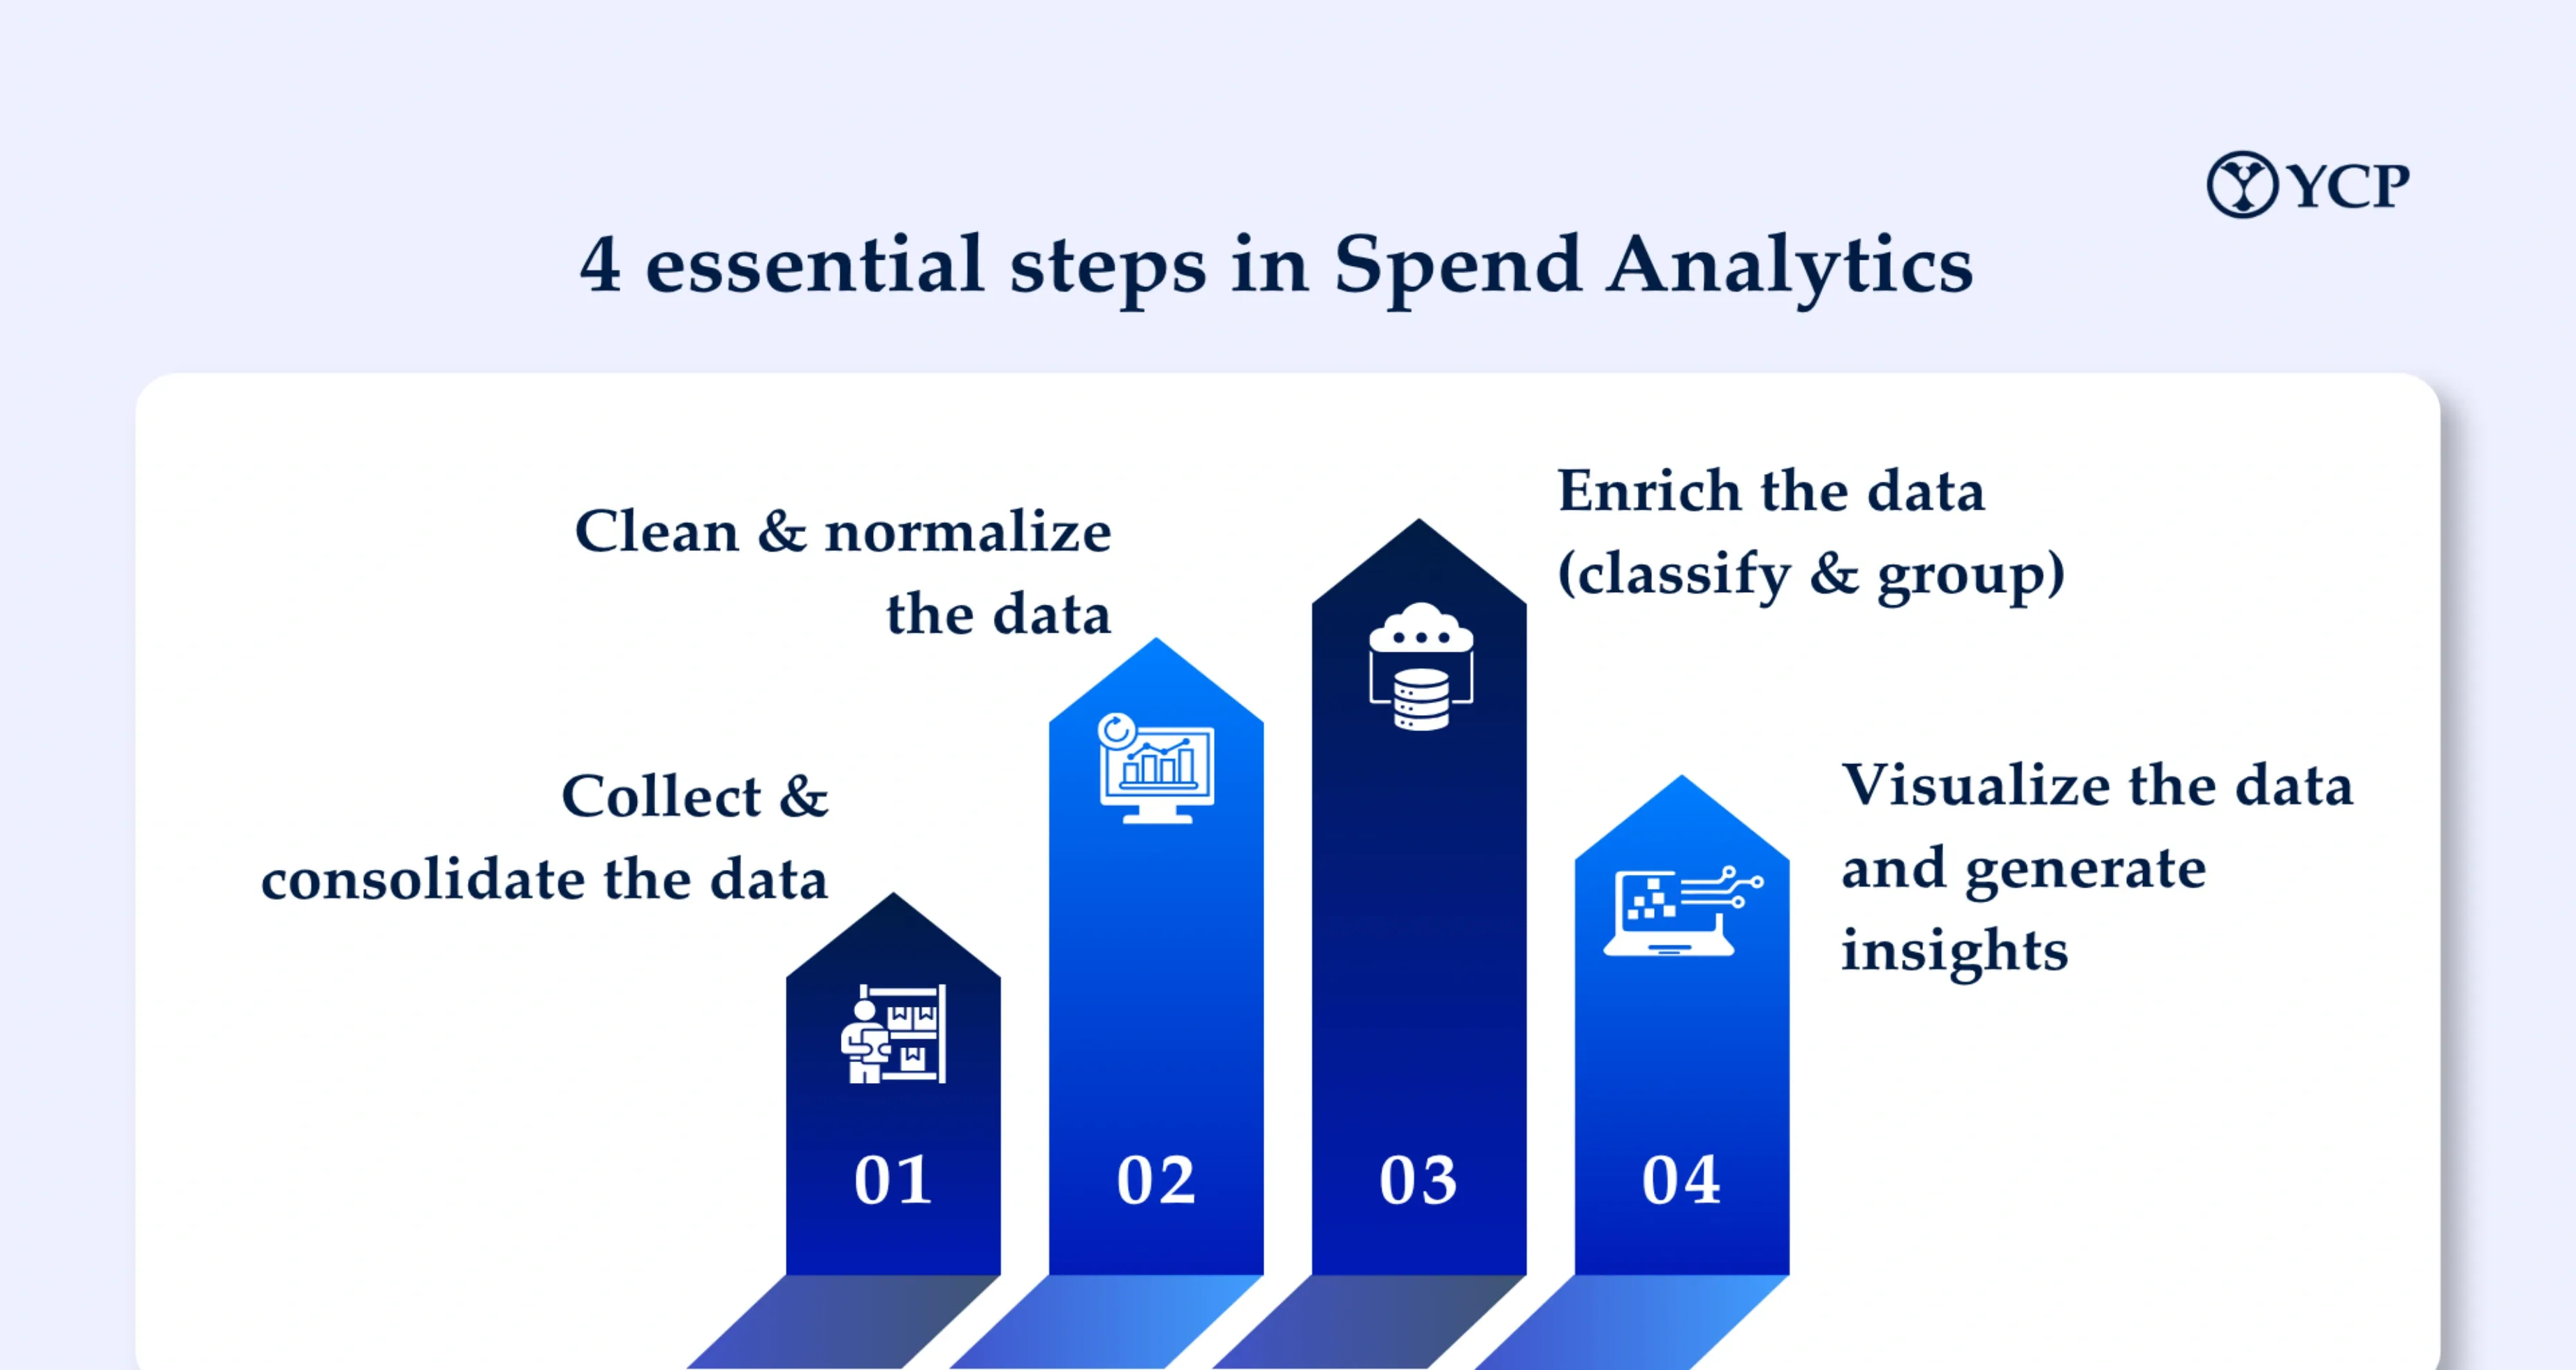
This is the starting point of most articles explaining the mechanism of spend analytics. But is that all a client expects when it runs a spend analytics programme? The answer is certainly negative. Unless this programme produces actionable insights or genuinely transforms how an organisation manages its money it is far from being a success.
As per various market studies the global spend analytics sector is growing at nearly 20% annually reflecting how organizations are keen to study their spend patterns and create insights aimed at cost reduction and improved efficiency. Yet investing in tools alone is not enough. This article covers the four steps that separate organisations that simply run spend analytics programmes and generate dashboards from those that use analytics to drive sustained business value.
The Four Steps That Separate Reporting from Real Value
1. Capture the Complete Spend Data Including What Is Hidden
Spend analytics starts with collecting the data, the right data with all the important fields required to analyse it correctly. The data mostly comes from the ERP or procurement tools. But in most organisations this captures only 60% to 70% of actual spend. The remainder is what is called dark spend and it is where some of the highest-value opportunities hide.
This spend comes from spending on professional services, intercompany transactions, emergency and one-off purchases and software tools purchased by individual teams via corporate cards. These purchases are staggered and often go unnoticed. They do not follow any procurement guidelines and hence there is no cost competitiveness or benchmarking. This makes dark spend a good candidate for analytics coverage with high chances of generating cost benefits through consolidation and contract coverage.
For example individual business units may independently subscribe to similar software applications, purchase identical office supplies from different vendors or engage consultants without leveraging existing enterprise agreements. Individually these purchases appear insignificant. Collectively they represent substantial savings opportunities.
Capturing this hidden spend transforms analytics from a reporting exercise into a comprehensive view of organisational expenditure. Equally important is documenting the scope of analysis. Every spend analytics programme should clearly define:
What spend has been included
What spend has been excluded
Data sources used
Assumptions and limitations
This not only improves transparency but also creates a repeatable framework for future refreshes and continuous monitoring.
The objective isn't simply to collect data. It's to ensure no meaningful spend remains invisible.
2. Transform Spend Data into Procurement Intelligence
Once the data has been collected and brought together from multiple systems in a common format we now have a single source of truth. The next step is to cleanse the data and normalize it. But cleansing and normalization alone are not sufficient. The data needs to be enriched.
Cleansing produces data you can trust. Enrichment produces data you can act on.
The enrichment includes:
Supplier De-duplication: The same suppliers appear with different naming styles across business units. Standardisation of supplier names is therefore required to identify true supplier concentration and consolidation opportunities.
Currency and Unit of Measure Mismatches: Multi-entity organisations often have the same supplier paid across multiple currencies with items purchased using different units of measure. These need to be normalized to ensure meaningful comparisons across business units. Without normalization savings calculations will be wrong.
Taxonomy Conflicts: Different systems frequently use different classification codes for identical spend. Merging without a consistent taxonomy produces a dataset that cannot be compared across business units or time periods. As such a common procurement taxonomy is required to enable category-level analysis across all systems.
Beyond the above the real value lies in further elevating this cleaned consolidated and enriched data with intelligence allowing spend analytics to move from reporting to decision support:
Contract coverage flags to identify purchases outside contracts and contract leakage spend, purchases made at higher rates by bypassing contracted rates.
Supplier risk scores: Single-source dependency is one example. A supplier representing 40 percent of a category may represent a consolidation achievement while simultaneously creating a vulnerability. Other risks include financial geopolitical and operational risk.
Maverick spend tracking: Identify purchases made outside approved procurement processes. Monitoring maverick spend by business unit helps highlight compliance gaps purchasing behaviour and areas where procurement policies need strengthening.
Addressability classification: Not all organizational spend can be influenced by procurement. Classifying spend into addressable and non-addressable categories helps set realistic savings targets and ensures improvement efforts are focused where procurement can actually make an impact.
By combining transactional data with procurement intelligence organisations can prioritise sourcing initiatives reduce supplier risk and identify opportunities that would otherwise remain hidden.
3. Analyse Beyond the Dashboard: Descriptive to Prescriptive
Creating dashboards is where most spend analytics projects declare victory. Organizations can see their top vendors top categories spend trends buying patterns and other visuals.
Dashboards tell you what happened. Effective dashboards tell you what should happen next.
· Descriptive: What did we spend where and with whom? Useful for understanding the baseline but produces no recommended action on its own.
· Diagnostic: Why did spend increase in this category? What drove the variance? This is where patterns become problems and where procurement can begin to assign accountability.
· Predictive: What is likely to happen based on demand market trends and sourcing pipeline? This level moves procurement from reactive to proactive by identifying cost pressure before it arrives rather than after.
· Prescriptive: What actions should procurement take what savings are expected and what should be prioritised? This is where insights become decisions. Examples of prescriptive recommendations include:
Consolidate fragmented suppliers into strategic contracts.
Standardise similar products across business units.
Shift off-contract purchases to preferred suppliers.
Renegotiate freight lanes and payment terms.
Launch sourcing events for high-spend categories showing significant price variance.
These are not generic recommendations. Each one is directly derived from what the data surfaces which is what separates prescriptive analytics from intuition-based decision-making. The goal is not to produce more reports. It is to produce fewer better questions that lead directly to sourcing action.
4. Systemise Automate and Activate: Make Spend Analytics a Continuous Capability
This is the final step in spend analytics that organisations generally overlook. In the majority of engagements spend analytics is considered a one-time project or organisations stop after a couple of refreshes.
While this may be acceptable as a starting point if spend analytics is treated as a standalone project the real value will never come out. No one wants to simply stop at what happened in the past. If analytics is performed only once or twice a year organisations are constantly reacting to problems that could have been identified much earlier.
So the approach should be:
Spend analytics implementation including dashboard development to establish a baseline.
Periodic dashboard refreshes to monitor trends.
Dashboard integration with ERP and procurement systems to automate data collection.
Continuous decision support with alerts AI-driven anomaly detection supplier risk monitoring and savings tracking.
Automation enables procurement teams to focus less on preparing data and more on driving supplier performance contract compliance working capital improvement and measurable savings.
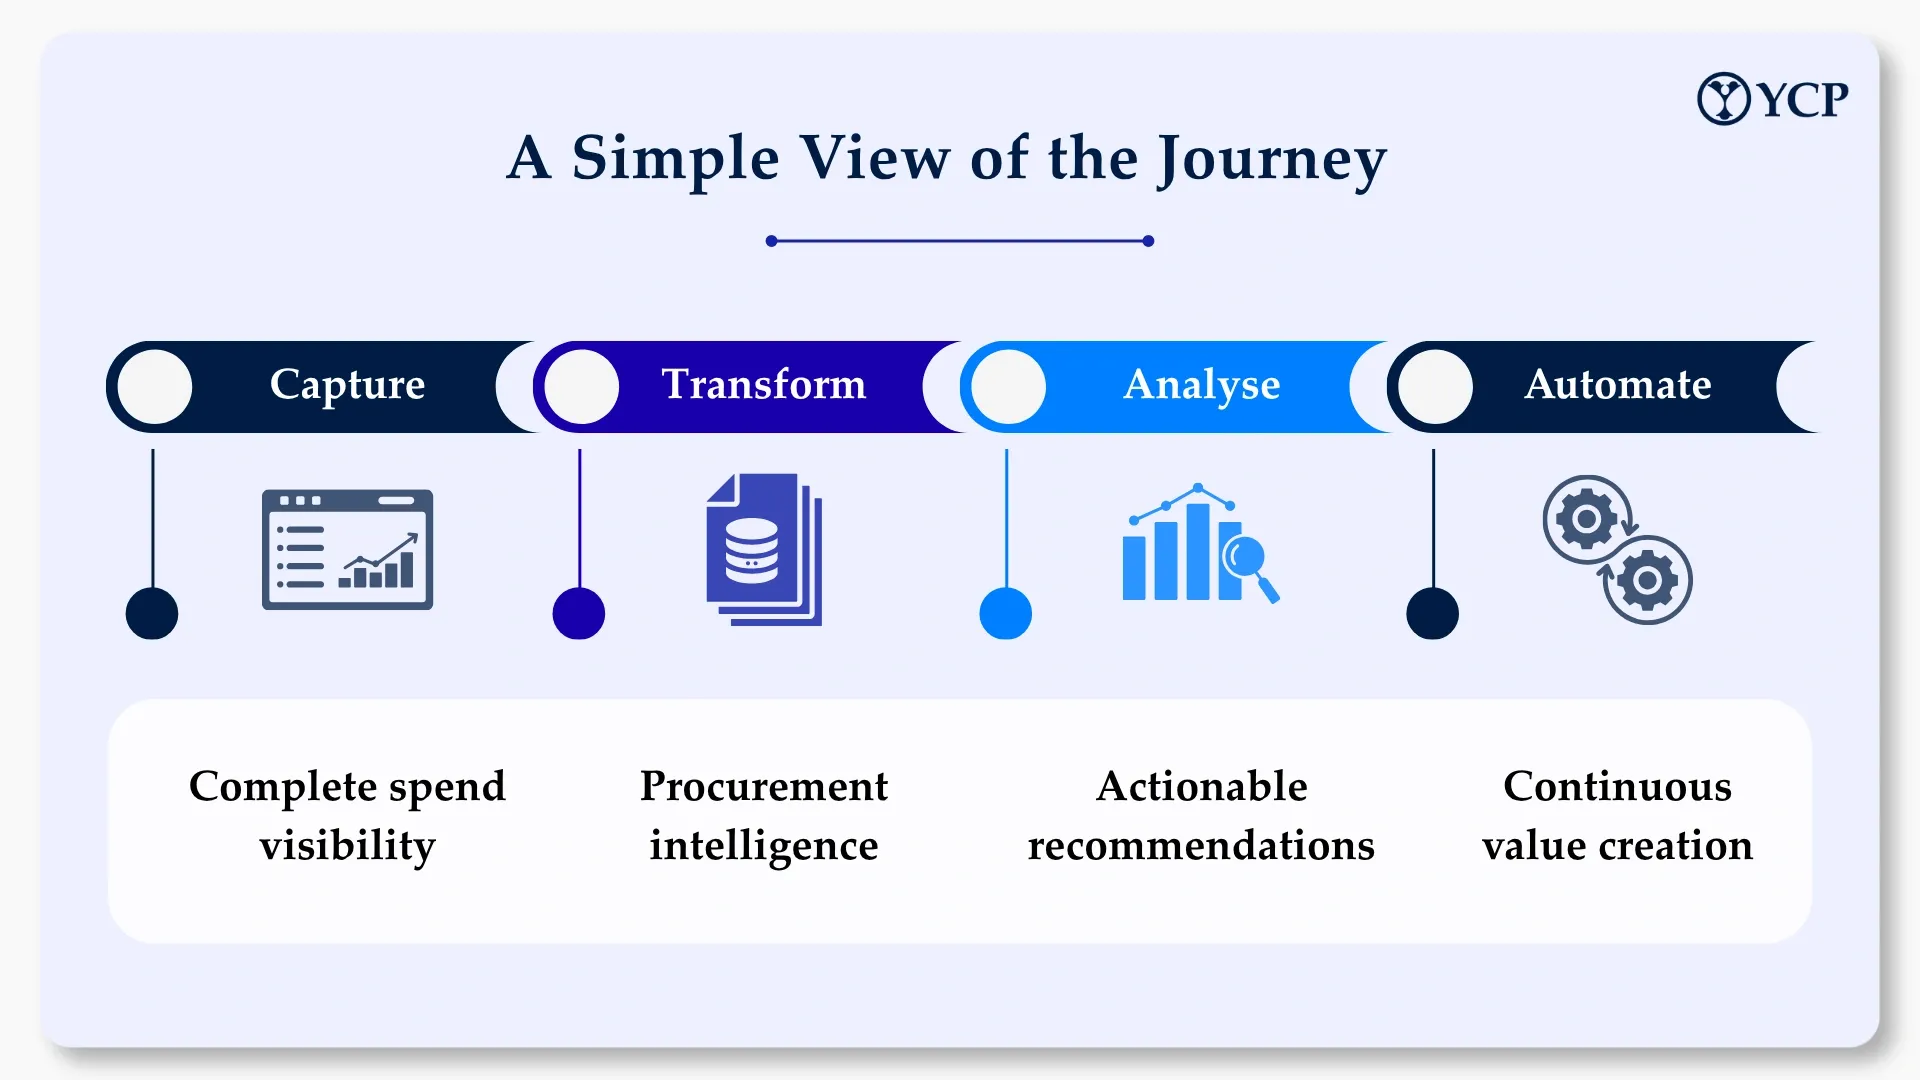
From Reporting Spend to Driving Business Value
Spend analytics is often perceived as a reporting exercise but dashboards alone rarely transform procurement performance. The organisations that consistently realise measurable value capture complete spend visibility enrich data with procurement intelligence move beyond descriptive reporting into prescriptive recommendations and embed analytics into day-to-day decision-making through automation.
The true success of a spend analytics programme should not be measured by the number of dashboards produced but by the business outcomes it delivers, reduced costs improved contract compliance lower supplier risk stronger supplier relationships and better procurement decisions. When spend analytics becomes a continuous organisational capability rather than a one-time project it evolves from a reporting tool into a strategic capability that continuously shapes procurement and business performance.
Get in Touch with Us
Get in touch with us to discuss your strategic needs and how we can help you develop a plan to accelerate your growth
Schedule a ConsultationRelated Articles

Control Before Spend: The Next Evolution in T&E
Financial Services
The Handoff Nobody Talks About: Where Strategic Sourcing Meets Source-to-Pay
Financial Services
The Four Pillars of High-Performing Source-to-Pay Organizations
Financial Services