From Fragmented Excel Reports to One Supply Chain View: A US Printing Ink Manufacturer’s Journey

A leading US-based manufacturer of printing inks and related products was facing major disruption across its supply chain following a fire incident at one of its manufacturing plants. As the business worked to restore operational continuity, leadership needed a clearer view of manufacturing output, inventory, shipments and backlog.
The challenge was compounded by a reporting environment built around multiple Excel files generated from different operational systems. These reports were manually consolidated and circulated by email every day, requiring significant effort from multiple teams while leaving leadership without a single, real-time view of the supply chain.
YCP Supply Chain was engaged to rapidly improve supply chain visibility and establish a centralized reporting capability that could support both immediate operational needs and longer-term automation.
The objective was clear: replace fragmented reporting with a connected, interactive view of supply chain performance that could help leadership make faster, data-driven decisions.
Challenges
The disruption exposed a broader visibility gap. While individual operational data was available, it was fragmented across reports and systems, making it difficult to understand the full supply chain picture.
No single view of the supply chain: Manufacturing, inventory, shipments and backlog were tracked through separate operational reports, with no consolidated view of overall performance.
Manual daily reporting: Multiple teams spent significant time consolidating and circulating Excel reports by email every day.
Fragmented operational tracking: Key supply chain metrics could not be viewed together, limiting the ability to connect production, inventory, shipments and backlog.
Limited trend visibility: The existing reporting setup made it difficult to identify performance trends across different time periods and respond proactively.
No demand-fulfillment check: There was no mechanism to assess whether production and inventory levels were sufficient to fulfil customer demand.
In the aftermath of the plant disruption, these gaps became particularly important. The organization needed to understand not only what was happening across the supply chain, but also how performance was changing over time and whether available supply was sufficient to meet demand.
Approach
Given the urgency of the requirement, YCP Supply Chain proposed a phased Power BI dashboard rollout designed to deliver immediate business value while creating a path towards advanced analytics and automated reporting.
Phase 1: Rapid Dashboard Deployment
The first phase focused on creating a single operational view within three weeks. Manufacturing, inventory, shipments and backlog data from daily Excel reports were consolidated into one interactive Power BI dashboard.
The dashboard enabled users to analyze performance across daily, weekly, monthly and yearly periods, replacing manual report preparation with a centralized view of supply chain operations.
Phase 2: Advanced Supply Chain Analytics
Once the core reporting foundation was established, the dashboard was enhanced with dynamic KPI tracking, trend analysis and cross-functional comparisons.
The enhanced view connected manufacturing output, inventory sufficiency, shipment pace and backlog movement, helping users understand relationships between operational indicators and identify emerging trends more effectively.
Phase 3: Data Automation & SAP Integration
The next stage focused on creating a scalable architecture for automated reporting. YCP discovered that SAP reporting data was already maintained in Snowflake and proposed integrating the dashboard with Snowflake rather than connecting directly to SAP.
This approach aligned the solution with the client's existing data architecture and created a pathway towards automated daily Power BI refreshes and more timely supply chain decision-making.
Maintaining Business Continuity During the Transition
While the underlying Snowflake data structures were still being developed, the dashboard remained in use through scheduled weekly manual refreshes. YCP also developed data models and DAX calculations to accurately represent the operational relationships between manufacturing, inventory, shipments and backlog.
A separate engagement was initiated to enable the client to publish SAP data into Snowflake and automate the Power BI refresh process, allowing the dashboard to evolve beyond an interim reporting solution.
Impact
The phased transformation quickly improved supply chain visibility while establishing the foundation for longer-term automation.
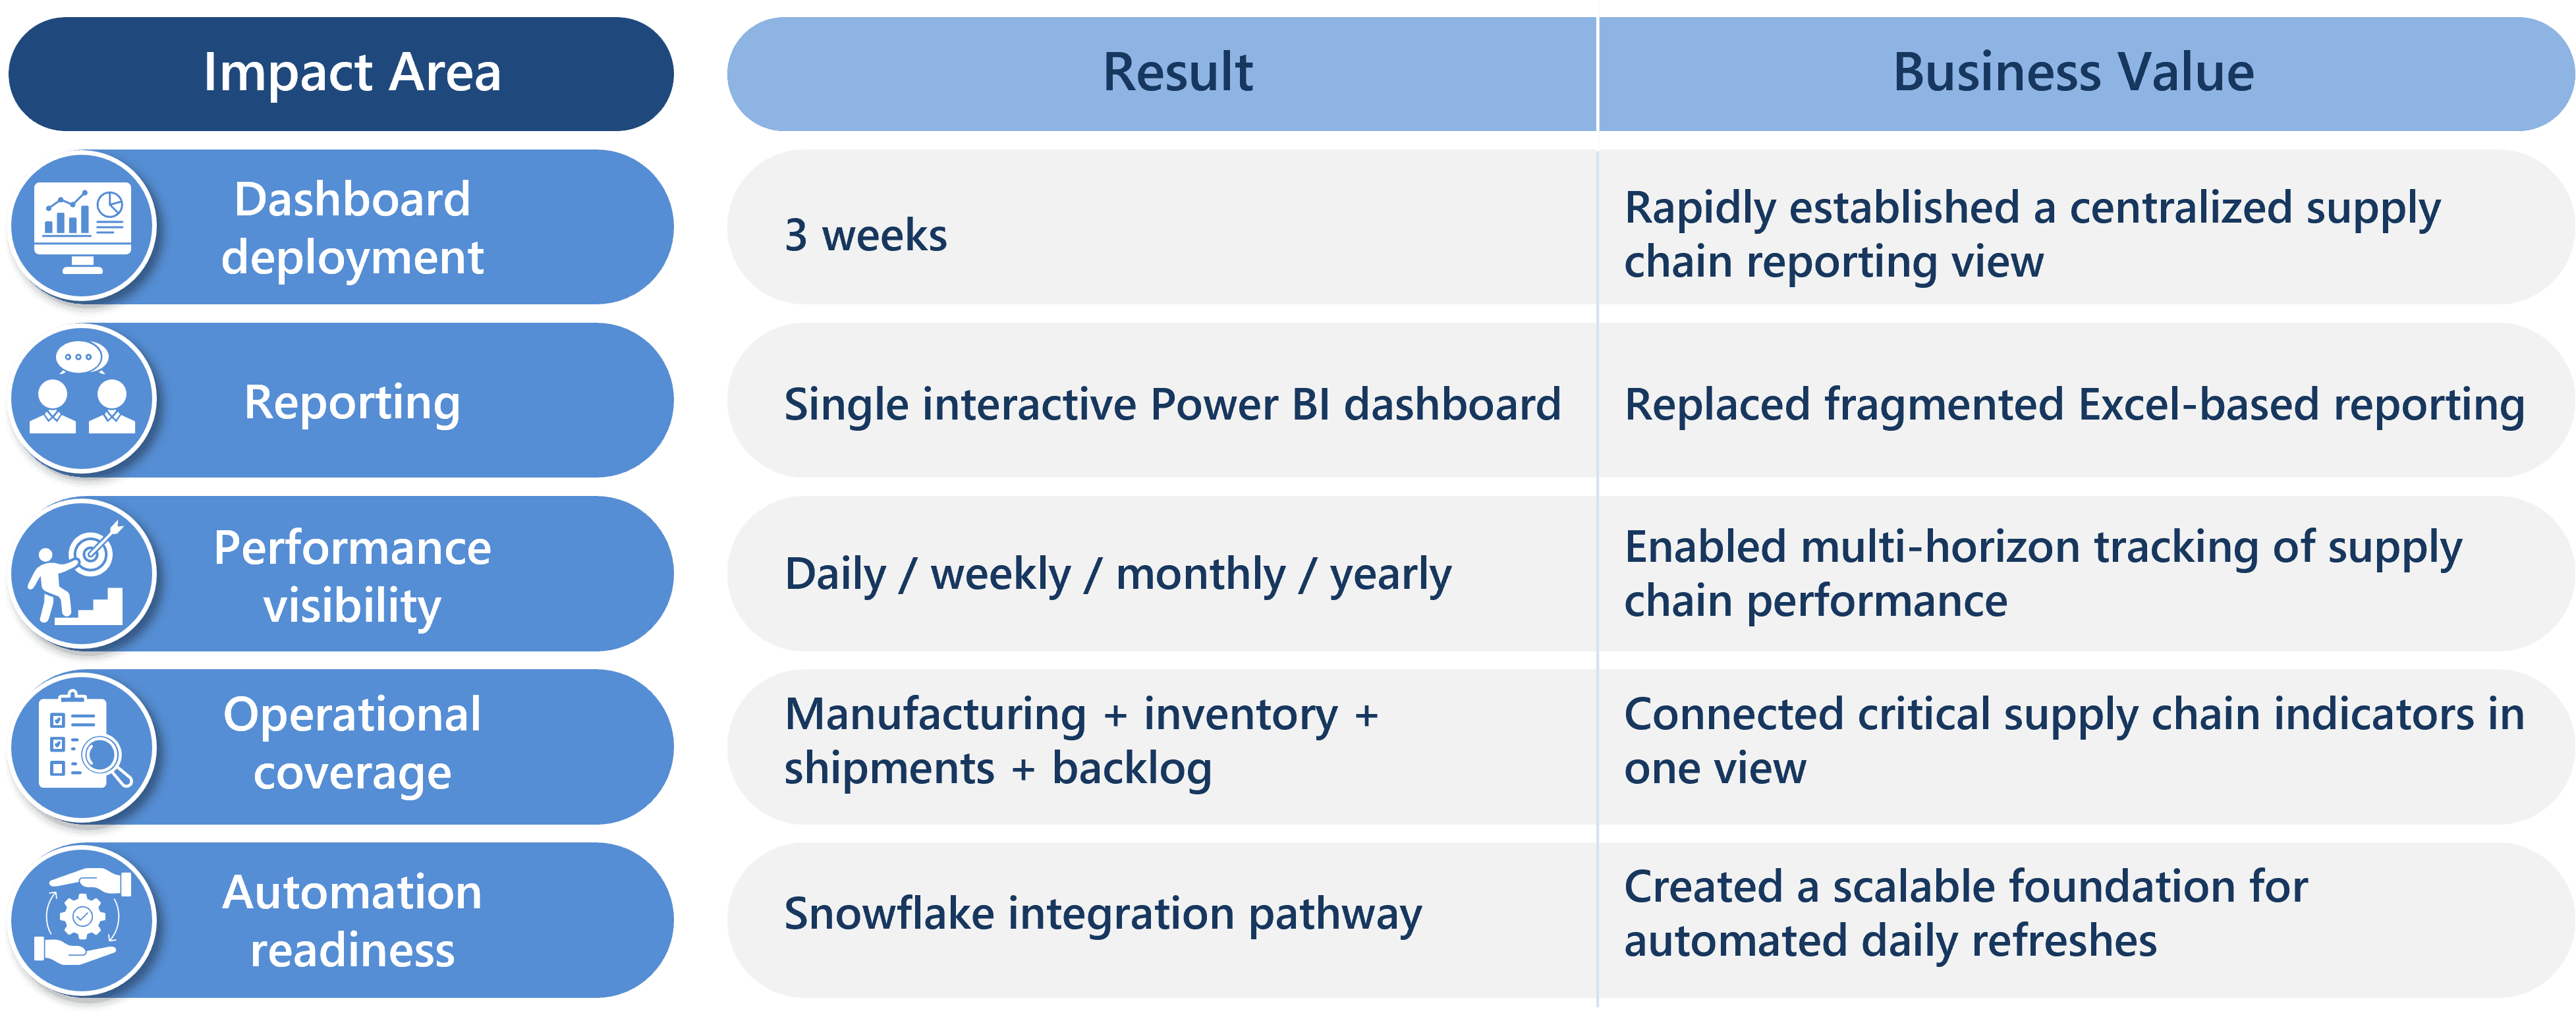
The organization moved from multiple manually consolidated Excel reports to a single interactive Power BI dashboard covering manufacturing, inventory, shipments and backlog. This reduced the effort associated with daily reporting and gave leadership a more connected view of supply chain performance.
The solution also introduced multi-horizon performance tracking, enabling teams to assess supply chain performance across daily, weekly, monthly and yearly periods and identify shipment and backlog trends following the plant disruption.
Most importantly, the dashboard created a scalable foundation for automated reporting through Snowflake, positioning supply chain reporting to become faster, more reliable and increasingly data-driven.
Impact at a Glance
Outcome
By consolidating fragmented operational reporting into a single Power BI dashboard, the manufacturer gained a clearer and more connected view of its supply chain at a critical time.
The transformation reduced reliance on manual report assembly, strengthened visibility across manufacturing, inventory, shipments and backlog, and enabled performance to be tracked across multiple time horizons.
What began as an urgent response to a supply chain disruption evolved into a scalable decision-support platform. With a path established for Snowflake integration and automated refreshes, the organization was positioned to move from manual reporting towards more timely, data-driven supply chain management.